HISTORY SCANNER: EXAMINE THE MARKET IN A Systematic wayYou may possibly wonder what happened to the stock market when the Robot Investment Calculator indicators showed similar values as today back in the history. Another question that comes to mind is how particular indicators fared in different times, good or bad. The most important question of all, however, is which combination of the indicator values proved to have been a good buy or sell signal.
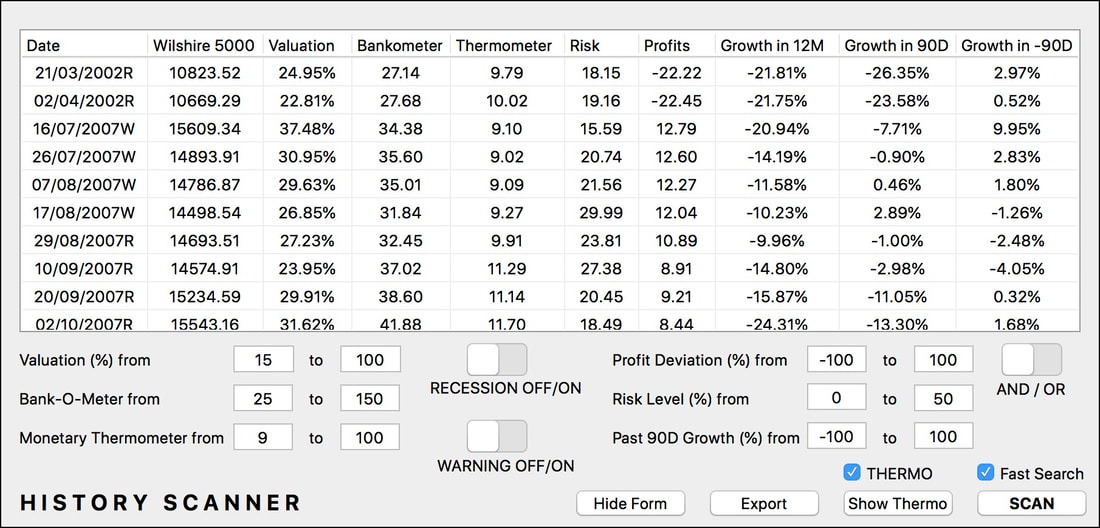
The functionality History Scanner provides you with the possibility to find answers to all of the above questions. You simply enter the required value intervals into the form and press SCAN. The History Scanner, after a moment of data crunching, generates a table, which tells you what happened in the history under the given conditions. If the table seems to long, you can export it to Excel and examine it offline. |
New functionalities:
HISTORY SCANNER MARKET THERMOVISION 
|
History Scanner will change the way you perceive the market. Stop guessing like most other investors do. No more trials and errors, often costly errors: now you can analyse the market movements in a systematic manner. You will know why the stock indices go up and down.
For instance, you may wonder why the US stock market became choppy in 2018 after two years of solid returns with low volatility. History Scanner will tell you why (and no, the Facebook data privacy scandal was just a catalyst; the same holds for the US-China trade dispute.) Similarly, it turned out to have been a smart move to sell out stocks in the first half of February 2020. Sure, the Robot Investment Calculator did not forecast the Corona virus mayhem, but it could have told you the market was way too expensive - and it indeed told its users this important finding on time.
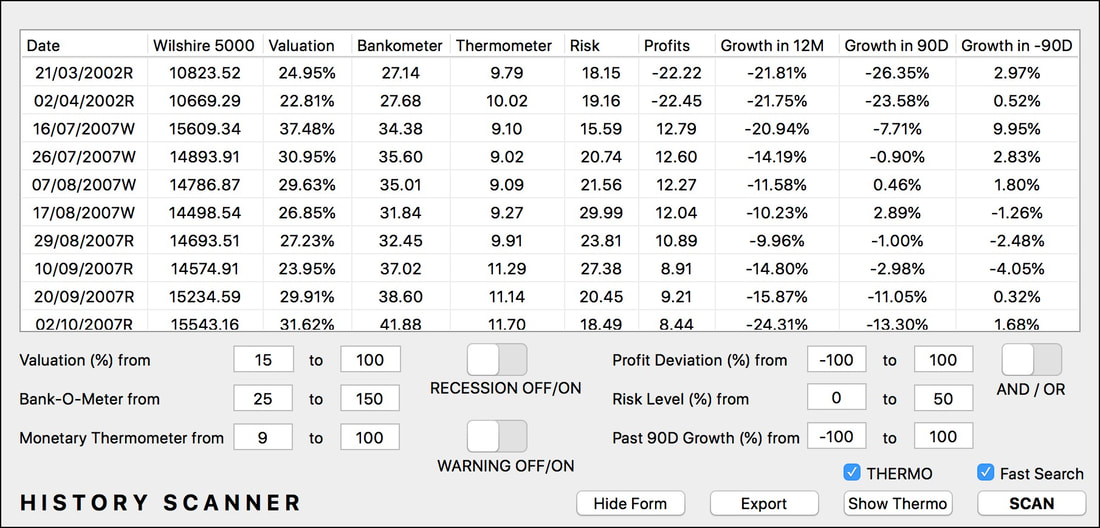
This is how the History Scanner input and output form looks like:
For instance, you may wonder why the US stock market became choppy in 2018 after two years of solid returns with low volatility. History Scanner will tell you why (and no, the Facebook data privacy scandal was just a catalyst; the same holds for the US-China trade dispute.) Similarly, it turned out to have been a smart move to sell out stocks in the first half of February 2020. Sure, the Robot Investment Calculator did not forecast the Corona virus mayhem, but it could have told you the market was way too expensive - and it indeed told its users this important finding on time.
This is how the History Scanner input and output form looks like:
MARKET THERMOVISION: THE STOCK MARKET THERMOMETER IN COLOURS
When looking through stock index charts you might think it would be so great to know if the market was undervalued or overvalued at a certain point of time. If we only knew, for instance, that the market was red hot on 20 February 2020...
Or, vice versa, having known that the market was really cheap on 11 February 2016, even if many "experts" warned about high P/E ratio would have just been great. Not to mention the dramatic years of the Great Financial Crisis from 2007 to 2009 when the market changed its temper during a relatively short period of time from overheated to deeply frozen. The no less dramatic years of the dot.com bubble-and-bust come to mind, too.
The functionality MARKET THERMOVISION will open your eyes to a new perspective of understanding the market. While the ubiquitous P/E ratio fails most miserably when it is most needed, while all the textbooks of investing and portfolio management will teach you the quasi-religious faith in "effective markets", MARKET THERMOVISON will tell you how the market really works. First of all, you will know when the market is cheap and when it's not -- and why.
Or, vice versa, having known that the market was really cheap on 11 February 2016, even if many "experts" warned about high P/E ratio would have just been great. Not to mention the dramatic years of the Great Financial Crisis from 2007 to 2009 when the market changed its temper during a relatively short period of time from overheated to deeply frozen. The no less dramatic years of the dot.com bubble-and-bust come to mind, too.
The functionality MARKET THERMOVISION will open your eyes to a new perspective of understanding the market. While the ubiquitous P/E ratio fails most miserably when it is most needed, while all the textbooks of investing and portfolio management will teach you the quasi-religious faith in "effective markets", MARKET THERMOVISON will tell you how the market really works. First of all, you will know when the market is cheap and when it's not -- and why.
|
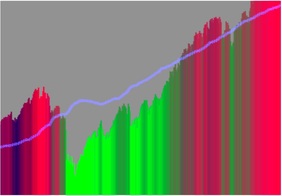
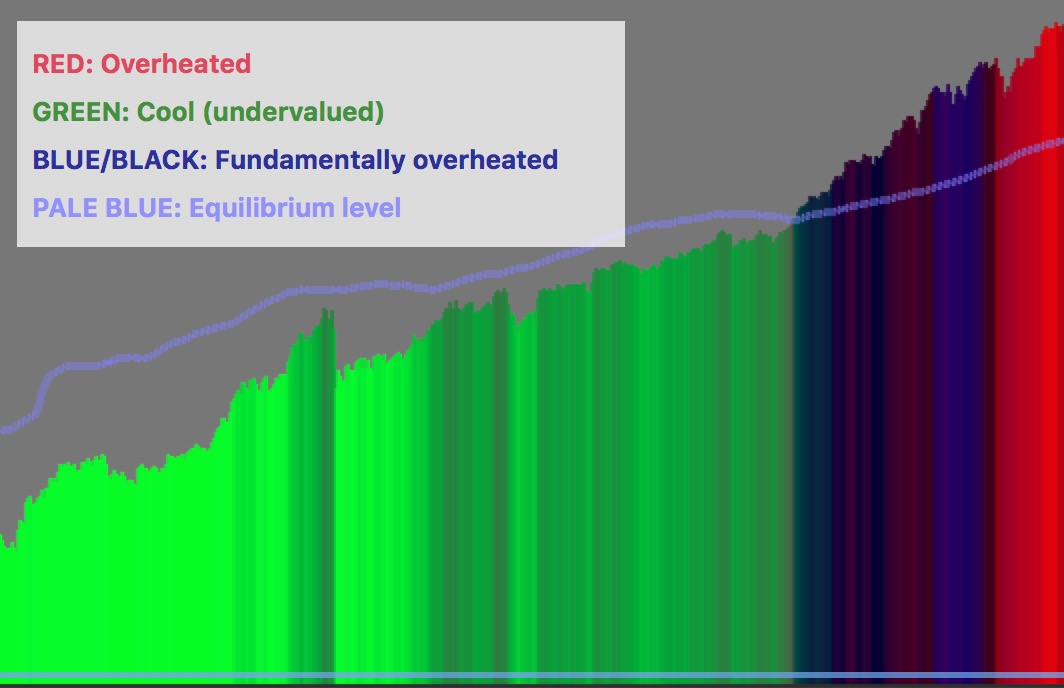
The colour codes are mostly intuitive: the brighter shade of red, the hotter the market. Similarly, bright green tells you when the market is cheap (or when it was cheap). What about the blue colour or indistinct dark shades? They indicate the periods of "fundamental overheating", i.e., when the market is expensive, but with a reason. The reason is usually above-the-trend corporate earnings. Obviously, the happy times with rich earnings never last forever, which is why the blue-to-black shades are followed by the ominous red.
|
|
To give the user a balanced perspective, the semi-opaque blue line indicates the equilibrium value of the stock market. That is, how much the index should be if all temporary factors were discounted away. The temporary factors include everything from macro indicators to earnings cycle to market sentiment. History shows us, quite convincingly, that all temporary factors fade away over time, and the market returns back to the equilibrium (while often overshooting to the opposite territory). This has been probably the most underrated fact about stock markets since the 1950's!
To avoid confusion: no, the equilibrium value is not base upon earnings, whether historical or projected. Neither is is calculated by moving averages of any kind. It is based on the liquid money aggregate MZM (Money Zero Maturity), which is published by the Federal Reserve. This is the most dependable indicator of monetary inflation available. Since it is published every week, your equilibrium index never gets obsolete.
The chart includes a trackbar to navigate through the whole period displayed. Also, you can manually enter a particular date, e.g., 24 December 2018, 9 March 2009, 12 October 2007, 13 February 2026 or 15 March 2000. Interested in the legendary crash of 1987? Then Market Thermovision is the right tool for you. Interested in what happens in the future? You're on the right place.
Market Thermovision also shows time intervals when the conditions entered in the History Scanner are fulfilled. These intervals are displayed as amber underlinings of the main chart.
To avoid confusion: no, the equilibrium value is not base upon earnings, whether historical or projected. Neither is is calculated by moving averages of any kind. It is based on the liquid money aggregate MZM (Money Zero Maturity), which is published by the Federal Reserve. This is the most dependable indicator of monetary inflation available. Since it is published every week, your equilibrium index never gets obsolete.
The chart includes a trackbar to navigate through the whole period displayed. Also, you can manually enter a particular date, e.g., 24 December 2018, 9 March 2009, 12 October 2007, 13 February 2026 or 15 March 2000. Interested in the legendary crash of 1987? Then Market Thermovision is the right tool for you. Interested in what happens in the future? You're on the right place.
Market Thermovision also shows time intervals when the conditions entered in the History Scanner are fulfilled. These intervals are displayed as amber underlinings of the main chart.

LEGEND
RED: Overheated market.
GREEN: Undervalued market. The brighter green the more undervalued.
BLUE: Fundamentally overheated. What does it mean? The stock market is expensive, but with a reason, which is above average level of corporate earnings. However, corporate earnings cannot remain in the above-average territory forever, which is why the blue colour is followed by red, sooner or later.
DARK TO BLACK: Fundamentally overheated.
GREY: Neutral valuation.
PALE BLUE: This colour is reserved to picture the equilibrium value of the stock market index, which would perfectly match the liquid money supply, assuming all other factors (earnings cycle, macro news, financial news) are discounted out.
MARKET THERMOVISION: ZOOM
|
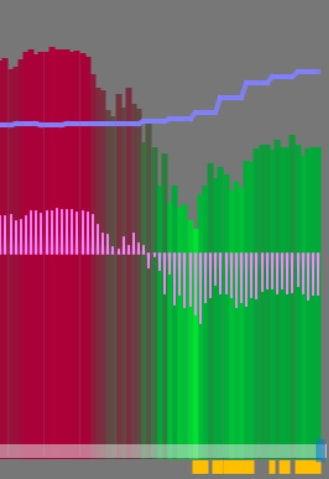
LEFT: The market (Wilshire 5000) during the Coronavirus crisis, from 30/1/2026 through 24/4/2020. Red means overvalued market, green cheap market, blue indicates equilibrium (theoretical) price, violet shows relative distance from the equilibrium. Yellow underlining indicate when a tested "buy" rule has been triggered.
The functionality MARKET THERMOVISION is connected to History Scanner; it cannot be run before history scanning is done. It also includes a useful chart called EVENT MONITOR. It looks like a series of yellow dashes below the main chart. The yellow dash shows the time when the conditions entered in the HISTORY SCANNER panel are fulfilled. In this particular case, a sell rule has been tested.
The graphic representation gives you a hint whether, e.g., the conditions entered may be used as buy or sell rules. You can easily get visual control over your proposed trading rules. A priceless feature! |
WILSHIRE 5000 PRICE INDEX
|
After many requests from the LEVEL 3 users, another stock market index has been added to the new upgrade. Admittedly, the Dow Jones Industrial 30 Index has some inherent flaws, and a more modern index has been needed.
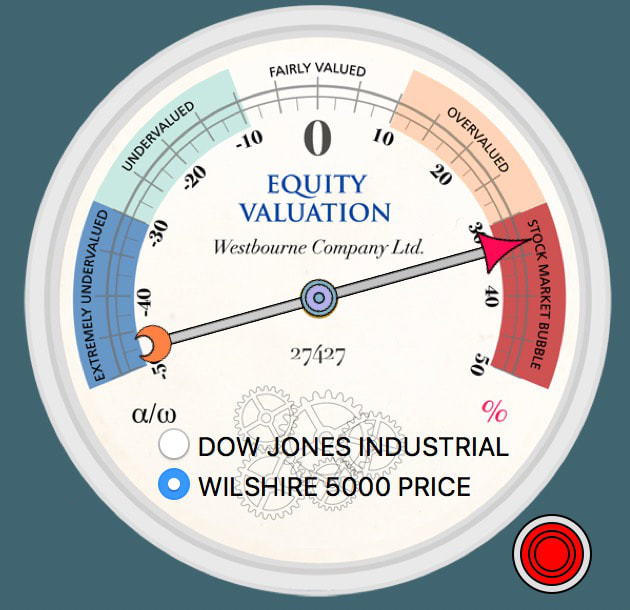
Therefore, Robot Investment Calculator RELEASE 2 includes Wilshire 5000 Price Index, which mirrors the whole US stock market prices. (It's just a price index, dividends not included.) The Wilshire 5000 is capitalisation-weighted, and its movements very closely resemble the most popular index ever, the S&P 500. If you invest in SPY or other ETFs based on the S&P 500 index, Wilshire 5000 will help you a lot in your decision making. However, we do not encourage you to ditch the good old Dow completely. It happens quite often that significant over- or undervaluation of the Dow has important implications for S&P 500 (or Wilshire 5000) returns in the short-to-medium run. |
Wilshire 5000 Price Index dne 20. února 2020
|
HISTORY SCANNER: THE TABLE AND HOW TO READ IT
DATE: Self-explaining; the letters R or W indicate when recession flag or preliminary recession warning flag was raised, respectively. Note that the signal letters do not indicate official recessions as declared by the NBER (National Bureau for Economic Research).
Dow Jones / Wilshire 5000: Value of the respective index at the date indicated in the left column.
Valuation: Rate of overvaluation (or undervaluation) with the respect to the liquid money supply at the given date.
Bankometer: Rate of overheating (or, vice versa, unused capacity) of the US banking system based on the growth or decline of the volume of business and commercial loans and the share of banks that restrict (or loose) criteria for providing loans. High values occur when a banking crisis may be near; very low values usually indicate the periods of temporary lull before another credit boom would begin.
Thermometer: Monetary "thermometer" tells the rate of year-on-year growth of liquid money supply (MZM) together with total volume of loans. The reading of this indicator is similar to Bankometer, and the two are often mutually correlated; yet the information provided is not identical.
Risk: Implied volatility indicator VIX; realised volatility (annualised) during the last 100 trading days is used through 1989.
Profits: This is not ROA or ROE or anything of that kind. "Profits" in the Robot Investment Calculator indicate the deviation of total earnings of all US companies (adjusted for inventory valuation and capital consumption) from the long term trend. For instance, the value of -22% means that US corporate profit level is 22% below the level where it should be without any cyclical factors. Deeply negative values may indicate mean reversion; same for highly positive values.
Growth in 12M: Growth of the respective index over the next 12 months. This is always a realised historical value, no forecast.
Growth in 90D: Same as the above over the next 90 days.
Growth in -90D: Growth of the respective index during the last 90 days.
Dow Jones / Wilshire 5000: Value of the respective index at the date indicated in the left column.
Valuation: Rate of overvaluation (or undervaluation) with the respect to the liquid money supply at the given date.
Bankometer: Rate of overheating (or, vice versa, unused capacity) of the US banking system based on the growth or decline of the volume of business and commercial loans and the share of banks that restrict (or loose) criteria for providing loans. High values occur when a banking crisis may be near; very low values usually indicate the periods of temporary lull before another credit boom would begin.
Thermometer: Monetary "thermometer" tells the rate of year-on-year growth of liquid money supply (MZM) together with total volume of loans. The reading of this indicator is similar to Bankometer, and the two are often mutually correlated; yet the information provided is not identical.
Risk: Implied volatility indicator VIX; realised volatility (annualised) during the last 100 trading days is used through 1989.
Profits: This is not ROA or ROE or anything of that kind. "Profits" in the Robot Investment Calculator indicate the deviation of total earnings of all US companies (adjusted for inventory valuation and capital consumption) from the long term trend. For instance, the value of -22% means that US corporate profit level is 22% below the level where it should be without any cyclical factors. Deeply negative values may indicate mean reversion; same for highly positive values.
Growth in 12M: Growth of the respective index over the next 12 months. This is always a realised historical value, no forecast.
Growth in 90D: Same as the above over the next 90 days.
Growth in -90D: Growth of the respective index during the last 90 days.
IMPROVED RECESSION INDICATOR
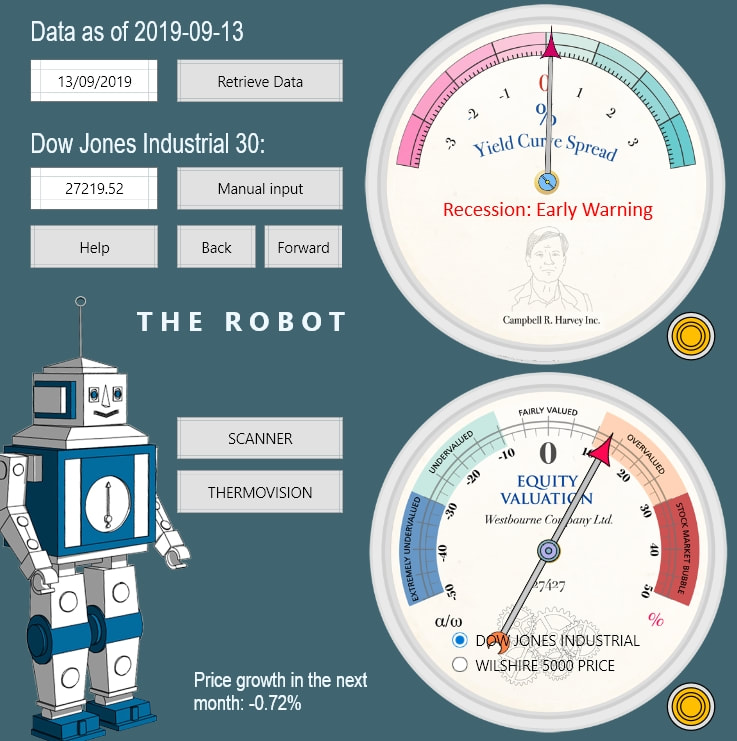
Robot Investment Calculator RELEASE 2 has an improved recession indicator, which includes an early warning system. As the picture shows, an early warning flag was raised as soon as in September 2019.
|
13 September 2019: Early Warning
Early warnings often appear really early, usually months before stock markets start tumbling and long, long before the recession is officially declared by then NBER.
Note that stock markets always start falling before the start of the recession. If you read that a recession has been declared, it's too late to sell stocks. However, with Robot Investment Calculator, you can't complain you haven't been warned early enough! |
OTHER IMPROVEMENTS
- While RIC LEVEL 3 only showed the last ten years of the Dow Jones on a daily basis, RIC RELEASE 2 shows full daily returns (of both Dow Jones and Wilshire 5000) back to December 1981.
- A few minor bugs were fixed, among others date inconsistencies when showing index and volatility values.
- A DEMO VERSION is available, including the option of easy online upgrading to the full RELEASE 2 PRO version.